Water Quality


-
Adopt a stream or pond
-
Map of adoptable spots


-
Upcoming events
-
Volunteer opportunities
-
Latest newsletter
-
Past newsletters


-
Biological Monitoring
-
Chemical Monitoring
-
Training information
Headlines
For previous news articles, go to News Archive.
Tracking Salt Runoff Events Under the Water Quality Monitoring Program
Tom Ligon, Master Naturalist
The Prince William Soil and Water Conservation District’s monthly Water Quality Monitoring Program collects chemical readings from streams and waterbodies from Prince William and its Cities. This program uses the YSI Pro DSS Probe which includes conductivity, an indicator of dissolved salts.
I wanted a way to track road chemicals entering the waterways after snow and ice events more frequently than the scheduled Conservation District's monthly YSI probe readings. I tried a cheap ($10) conductivity meter, but it did not temperature compensate and was grossly inaccurate. I switched to an Extech EC100 (around $60-70). This left me amazed. This meter is temperature-compensated and can be set up to duplicate the readings of a YSI Pro DSS almost perfectly. It is kept calibrated with YSI’s 1000 µS/cm fluid. It uses four-button batteries that may need replacement every year or two. The meter holds calibration well but will become inaccurate if the batteries run low.

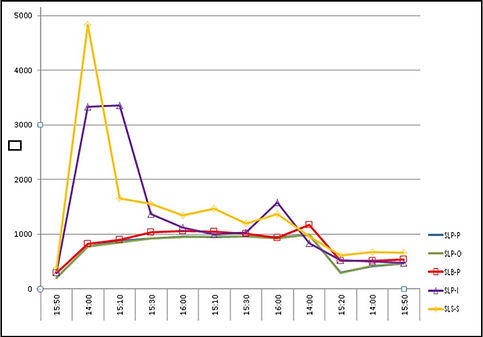
The plot to the right shows my readings for January 2024 on Sumner Lake in Manassas. The first reading, Jan 7, was my regular monthly reading. On Jan 17, we had heavy snow, and the city and many homeowners apply ice control chemicals. Halite (rock salt) was visible on nearby streets. The two highest plots are from the two primary inlet streams which carry undiluted runoff from the streets and storm sewers. The remaining points are bulk lake water, including the lake outfall, SLP-O.
Results: Normal levels are around 200-300 µS/cm. Readings over 800 µS/cm are cause for concern. The high readings did not last long. However, this shows what can happen when road chemicals are applied.
To learn more about Prince William County's initiative on salt in our waterways, visit:
https://www.pwcva.gov/department/environmental-services/winter-salts
To view Prince William Conservation's Alliance previous zoom meeting "Why So Salty? Freshwater Salinization - Trends and Regional Impacts: please go to https://www.youtube.com/watch?v=g3bTK_kwNSA.
Want to show support for water quality projects? Then check out the Chesapeake Bay License Plate! Click here for an application.


